

做一个 Data Agent,可以从一个很小的需求开始:给它一份销售数据,让它分析销售额下降主要来自哪些产品,并整理成一份带图表的简短报告。
完成这份报告,需要比较整体变化、按产品定位下降来源,并核对合计。遇到疑点时,再根据结果补充查询。
AVA 是面向 JavaScript 应用和 AI Agent 的开源数据分析与可视化框架。AVA 负责执行数据操作,Data Agent 负责根据结果组织下一步。
本文用 AVA 和 AI SDK,通过 53 行核心代码 搭建一个 Mini Data Agent。
准备数据
先准备一份销售订单数据,共 240 笔订单、12 个字段。下面列出前 3 笔订单的日期、产品和销售额:
| order_date(订单日期) | product(产品) | sales(折后销售额) |
|---|---|---|
| 2025-01-01 | Monitor | 224.10 |
| 2025-01-02 | Office Chair | 680.20 |
| 2025-01-04 | Monitor | 2,191.20 |
YOUR_DATA 表示完整 CSV 解析得到的对象数组,其中 sales 为数值。
定义语义
接着,告诉 Agent 这些数据该怎么算:销售额按折后金额统计,月份以下单时间为准,再比较各产品的销售额增加或减少了多少。
语义配置会把这些约定作为 AVA 生成查询的依据,减少模型对指标含义的猜测,也让后续追问沿用同一套口径。
models:
  - name: data
    tableReference:
      table: data
    properties:
      description: Each row represents one order.
cubes:
  - name: sales
    baseObject: data
    measures:
      - name: total_sales
        expression: CAST(SUM(sales) AS DOUBLE)
        type: DOUBLE
        description: Sales after discounts, calculated by summing sales.
    dimensions:
      - name: product
        expression: product
        type: VARCHAR
    timeDimensions:
      - name: order_date
        expression: CAST(order_date AS DATE)
        type: DATE
    properties:
      description: |
        Compare both periods using the same set of products. Change is current-period sales minus prior-period sales; negative values indicate a decline.
        Change rate is change divided by prior-period sales. Return null when prior-period sales are zero, indicating that the rate is not applicable.
YOUR_SEMANTIC 表示这段 YAML 解析后的对象。字段用法见业务语义。
构建 Data Agent
数据和口径准备好后,为 Agent 提供两个工具:analyze 查询和计算数据,visualize 接收绘图要求和数据,生成图表。ToolLoopAgent 把每次执行结果交回模型,让它决定继续分析、选择哪些结果传给 visualize,还是交付结论。
示例使用 Node.js 22.13.0 或更高版本,安装以下依赖:
npm install @antv/[email protected] [email protected] [email protected]YOUR_MODEL 是已配置好、支持工具调用的模型实例。将它与数据、语义一起传入,Agent 就能调用 AVA 开展分析:
import { AVA } from '@antv/ava';
import { ToolLoopAgent, isStepCount, tool } from 'ai';
import { z } from 'zod';

async function createDataAgent({ model, data, semantic }) {
  const ava = new AVA({ llm: { model } });
  await ava.source({ type: 'json', options: { data } });
  await ava.semantic(undefined, () => semantic);

  const messages = [];
  let analysis;
  let chart;

  const agent = new ToolLoopAgent({
    model,
    instructions: `Analyze the user's task step by step, using conversation history to make each query self-contained.
    Use analyze to compute and verify data.
    For visualize, select relevant rows and fields from analyze results; never invent or change values.
    Base conclusions on tool results and state what data is missing when evidence is insufficient.`,
    stopWhen: isStepCount(8),
    providerOptions: { openai: { parallelToolCalls: false } },
    tools: {
      analyze: tool({
        description: 'Query and analyze data using a self-contained question.',
        inputSchema: z.object({ query: z.string() }),
        execute: async ({ query }) => {
          analysis = chart = undefined;
          analysis = await ava.analyze(query);
          return analysis;
        },
      }),
      visualize: tool({
        description: 'Generate a chart from the visualization request and data returned by analyze.',
        inputSchema: z.object({ query: z.string(), data: z.array(z.record(z.string(), z.unknown())) }),
        execute: async ({ query, data }) => {
          chart = await ava.visualize({ query, data });
          return { chartType: chart?.chartType };
        },
      }),
    },
  });

  return {
    async ask(question) {
      chart = undefined;
      messages.push({ role: 'user', content: question });
      const result = await agent.generate({ messages });
      messages.push(...result.responseMessages);
      return { text: result.text, analysis, chart };
    },
    dispose: () => ava.dispose(),
  };
}
Agent 会保留对话和分析记录,方便继续追问。绘图时,它从分析结果中选择需要展示的行和列,通过 data 参数传给 visualize,不局限于最近一次分析结果。现在把开头的需求交给它:
import { writeFile } from 'node:fs/promises';

const assistant = await createDataAgent({
  model: YOUR_MODEL,
  data: YOUR_DATA,
  semantic: YOUR_SEMANTIC,
});

try {
  const task = `分析 2025 年 2 月较 1 月的销售额下降来源,列出各产品两个月的销售额和变化额,
按降幅排序、核对合计,并用条形图展示变化额。`;
  const answer = await assistant.ask(task);
  console.log(answer.text);
  console.table(answer.analysis?.data);
  console.log(answer.analysis?.sql);
  if (answer.chart) await writeFile('chart.html', answer.chart.html);

  console.log((await assistant.ask('Laptop 销售额下降是因为促销结束了吗?')).text);
} finally {
  await assistant.dispose();
}
查看结果
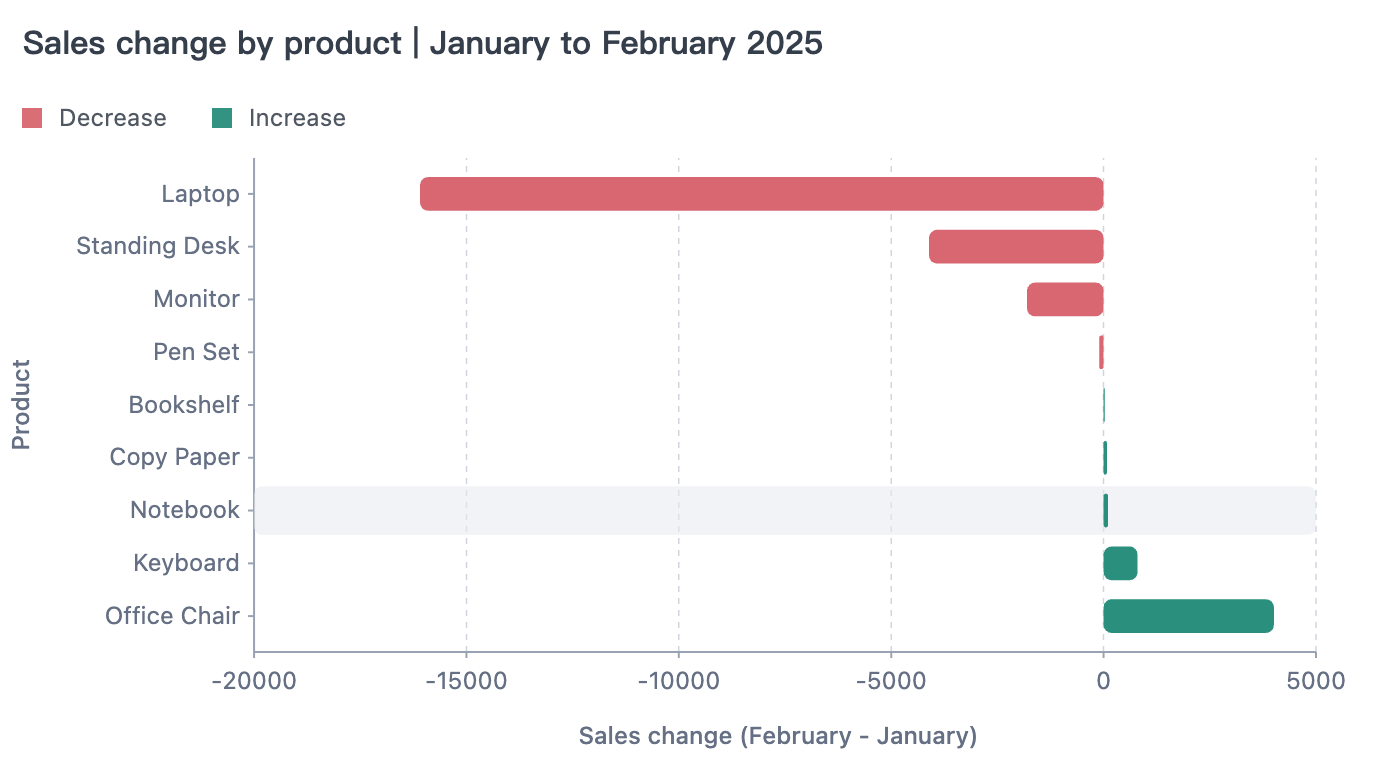
以这个任务为例,Agent 可以先用 analyze 比较两个月的总额,看到下降后再按产品拆解;核对各产品的变化额合计与整体一致,再用 visualize 画图并整理结论。如果合计对不上,就需要继续查询核对。
按这份数据汇总,销售额从 1 月的 38,897.18 降至 2 月的 21,804.11,下降 43.94%。各产品的变化如下:
| 产品 | 1 月销售额 | 2 月销售额 | 变化额(2 月 − 1 月) |
|---|---|---|---|
| Laptop | 19,688.10 | 3,596.00 | −16,092.10 |
| Standing Desk | 9,655.80 | 5,546.10 | −4,109.70 |
| Monitor | 6,536.25 | 4,731.00 | −1,805.25 |
| Pen Set | 232.20 | 127.71 | −104.49 |
| Bookshelf | 1,225.50 | 1,251.30 | +25.80 |
| Copy Paper | 59.19 | 137.06 | +77.87 |
| Notebook | 31.50 | 137.03 | +105.53 |
| Keyboard | 215.64 | 1,015.31 | +799.67 |
| Office Chair | 1,253.00 | 5,262.60 | +4,009.60 |
| 合计 | 38,897.18 | 21,804.11 | −17,093.07 |
各产品的变化额合计为 −17,093.07,与整体变化一致。画成图后,下降的来源更加清楚:Laptop 是主要拖累,Office Chair 的增长则抵消了部分下降。
接下来可以追问:“Laptop 销售额下降是因为促销结束了吗?”现有数据缺少活动时间和参与范围,还不能确认。定位下降来源之后,解释业务原因还需要证据。
接入自己的业务时,换成相应的数据和业务口径,再交给它新的分析任务即可。